
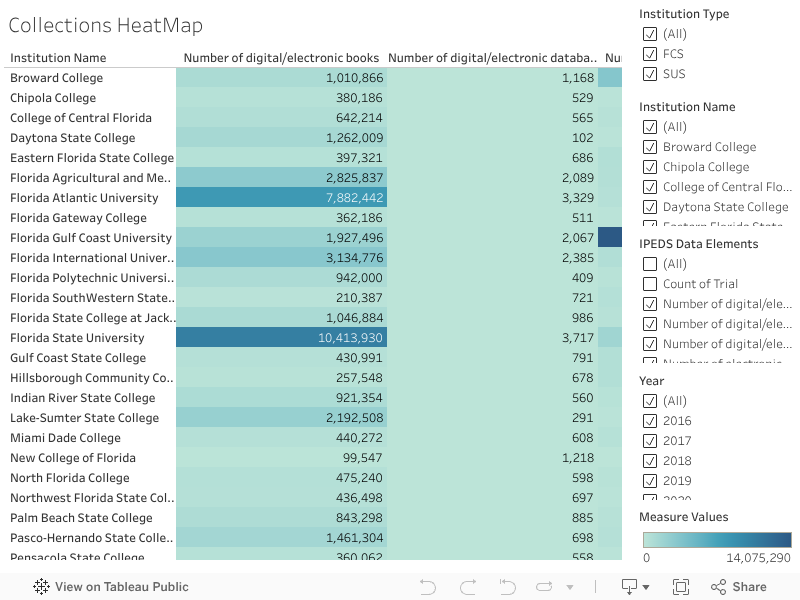
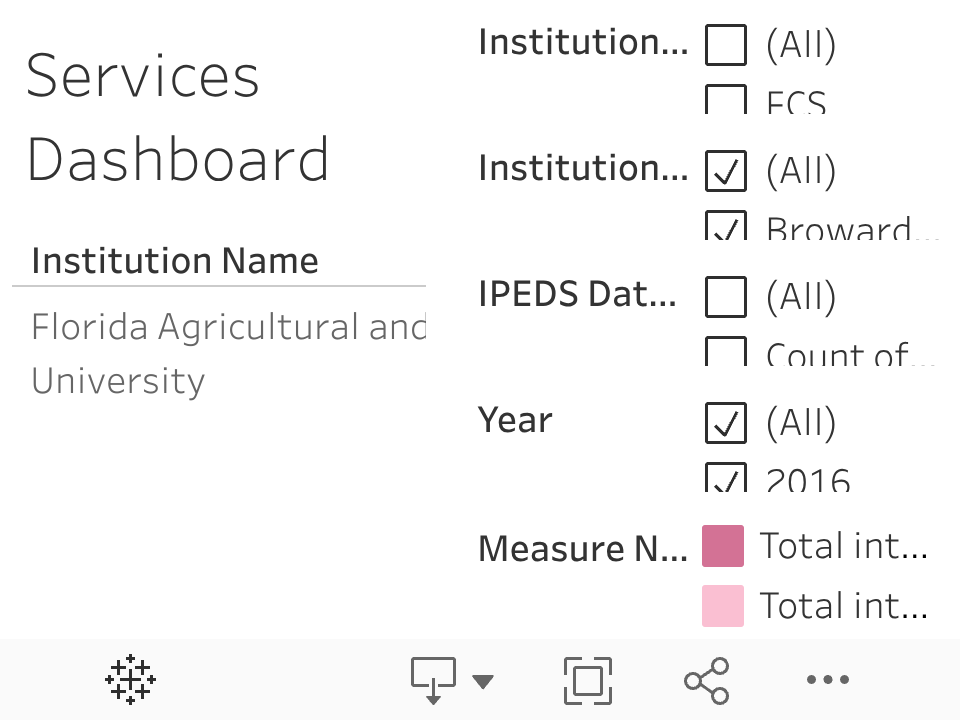
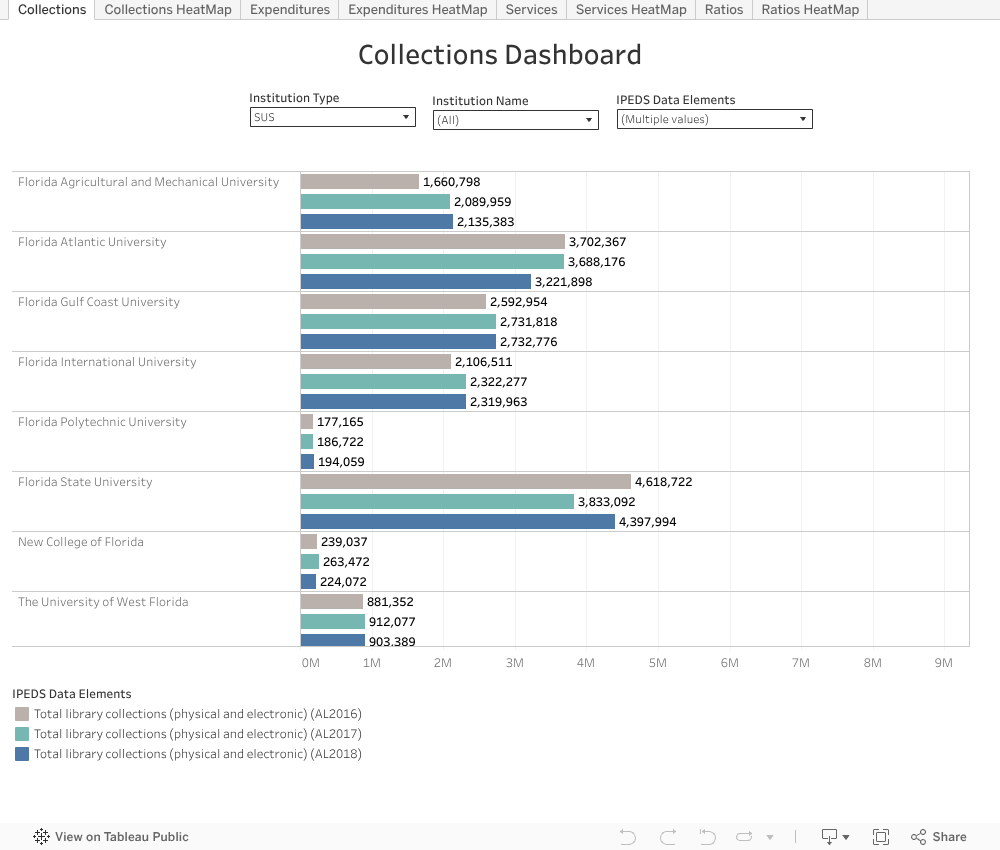
Three central dashboards included here are taken from the IPEDS Academic Libraries* survey data from 2016 to 2021 for all forty Florida FCS and SUS institutions.
As you scroll down, you will see:
On the right, for each dashboard, you can filter by institution type and name, IPEDS data elements, and year.
[*Note: IPEDS is also included in the ACRL Trends and Statistics Survey and may be pulled from the ACRL Benchmark site.]


In September of 2021, the members of the LASC began to work on a survey to gage how the various libraries in the Florida 40 were affected by the COVID-19 pandemic. The survey was developed to allow the various institutions to share changes in workflow, services, staffing, etc. The survey was conducted in Spring of 2022.
Academic Library Assessment: Strengthening the Collective, Library Assessment Conference, October, 2020
LASC Poster from Library Assessment Program
Project description. Over the past year, the Library Assessment Standing Committee (LASC) worked together to create a dashboard that would visually summarize data from all 40 institutions, as a means to share and interact with data from all public college and university libraries in Florida.
Florida 40 Dashboard Project Documentation
Introduction: The Florida Virtual Campus (FLVC; https://libraries.flvc.org/ ) leads and coordinates projects and resources for academic libraries at 40 state universities and colleges. By bringing librarians from different institutions together around shared goals, the committee identifies common needs and goals, leverages expertise to address these, and facilitates communication among all the libraries. The evaluation of data visualization tools has been a unifying project over the past year.

Literature Review
Horton & Pronovetz (2015) discuss the benefits of statewide consortial assessment activities. These include:
Academic library consortia have created dashboards to visualize data for shared collections, focusing on usage and return on investment/cost savings (e.g. Osterman et al., 2018). There are also examples of public library consortia dashboards that include different kinds of data (e.g. the Southeast Florida Information Network https://seflin.org/members/data-dashboard/public-libraries/). A similar project does not exist for public academic libraries in Florida.
Valerie Horton, & Greg Pronevitz. (2015). Library Consortia : Models for Collaboration and Sustainability. ALA Editions.
Horton, V. (2013). Going “All-in” for Deep Collaboration. Collaborative Librarianship, 5(2), 65–69.
Moore, A. C. & Croxton, R. (November 7, 2019). Demonstrating the Relationship between Inputs to Academic Libraries in a System and Student Success. Southeastern Library Assessment Conference.
Osterman, A. C., Morris, J., Price, J., McDonald, J., & McEvoy, K. (2018). Library Analytics: Shaping the Future - Consortial Usage Statistics, Analytics, and the CC- PLUS Project. Against the Grain, 30(4), 60–61.
Presenter Information
Alicia K. Long (longa@scf.edu) is the Access Services Supervisor at the State College of Florida, Manatee-Sarasota (SCF), Bradenton Campus Library, and an educator/adjunct professor. As part of the SCF librarians team, she provides reference, instruction, and is liaison to the Natural Sciences, Education, and Math departments and to the SCF Collegiate School. Alicia has a Masters in Library and Information Science from the University of South Florida. Alicia is an ALA 2012 Emerging Leader and a Spectrum Scholar.
Jennifer L. Murray (jennifer.murray@unf.edu) is the Associate Dean at the University of North Florida's Thomas G. Carpenter Library. With over nineteen years working in academic libraries, she has a diverse history in the field, ranging from supporting and enhancing library systems, managing all aspects of technical services, to using Tableau to develop informative, user-centric visualizations using library data.
Kirsten Kinsley (kkinsley@fsu.edu) is an Assessment Librarian at the Florida State University Libraries, a liaison with the College of Criminology and Criminal Justice, and a co-liaison with the Department of Psychology and the College of Social Work. Kirsten completed her Master of Science in Library and Information Studies in 1999 and received a Master of Science and Specialist in Education degrees in Counseling and Human Systems in 1995 from the Florida State University. In 1989, she graduated with a Bachelor of Science in Psychology with Honors. Ms. Kinsley has been working in libraries on campus in various capacities since 1991.
Tammera Race (trace@ncf.edu) is the Systems, Metadata and Assessment Librarian at the Jane Bancroft Cook Library, New College of Florida. She completed her Master of Library & Information Science through the University of Milwaukee. She has been a faculty librarian since 2010, working in instruction and technical services.
In 2020, the LASC sought to compare the merits between Microsoft PowerBI with Tableau using IPEDS Academic Library survey data by creating dashboards using each of the softwares. (We never got around to comparing Google Studio.) We decided that we preferred Tableau as a data visualization software but listed the pros and cons of both. See this link for the comparison.
In 2020, the LASC sought to compare the merits between Microsoft PowerBI with Tableau using IPEDS Academic Library survey data by creating dashboards using each of the softwares. (We never got around to comparing Google Studio.) We decided that we preferred Tableau as a data visualization software but listed the pros and cons of both. See this link for the comparison.

Purpose of the NEFLIN Assessment Project 2017-2018
Library Assessment 101 was a free, practical, 6-part course, designed to aid library staff in defining, designing, and deploying a library assessment project. Explore this page for more information: http://neflin.org/assessment/